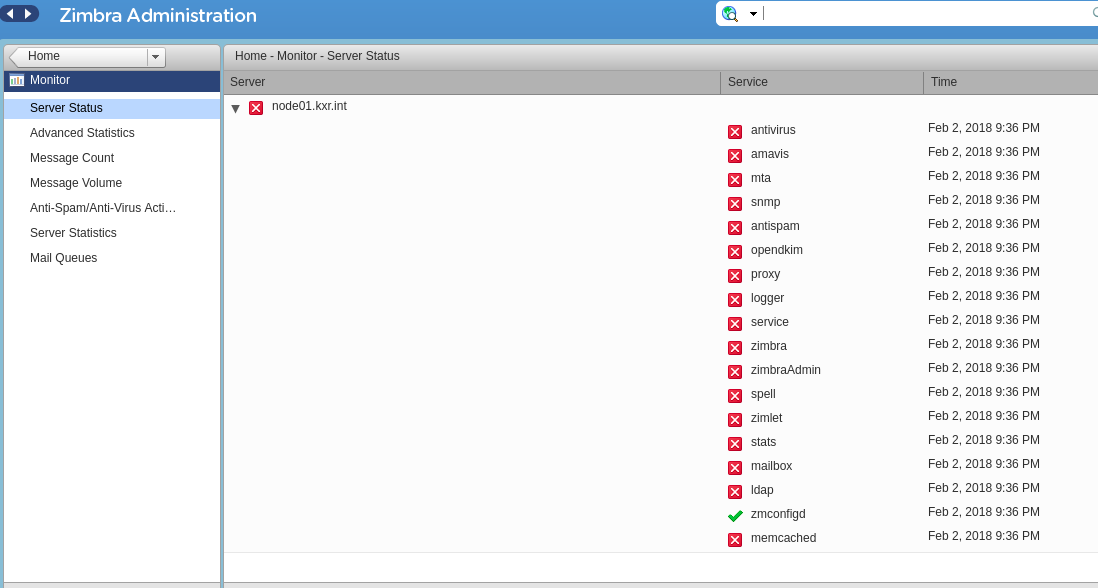
Zimbra Server Status shows all failed services
Zimbra have an old problem with its monitoring page. You might see all stopped status on Server Status page even when all Services are running.
To fix this issue:
1) Check the permissions of /var/spool/cron/zimbra file. It should be owned by zimbra and should be 600. If not please run:
chown zimbra:zimbra /var/spool/cron/zimbra
chmod 600 /var/spool/cron/zimbra
Wait for 30 minutes for any change to take effect.
If the above doesn’t fix your problem,
2) Change line in zimbra user’s crontab
from
*/30 * * * * /opt/zimbra/libexec/zmstatuslog > /dev/null 2>&1
to
*/2 * * * * /opt/zimbra/libexec/zmstatuslog > /dev/null 2>&1
3) Then restart zmstatctl service
zmstatctl restart
4) Run the status logger manually:
/opt/zimbra/libexec/zmstatuslog
Again, wait for 30 minutes for any change to take effect.
Monitor server status for couple of hours to make sure that the status hasn’t changed back.
RRD tool time offset (Zimbra 8.8 and above)
Another issue that might cause the zimbra server status to fail could be because of RRD tool time offset. RRD is now being used in the latest ZCS versions to display the graphical output under Zimbra Monitor. This issue can come if for some reason the timezone or time of the zimbra host machine is changed after the installation of zimbra.
To verify the rrd time offset you should get this error message in '/opt/zimbra/log/zmlogswatch.out'
illegal attempt to update using time <EpocTime> when last update time is <EpocTime>
This happens because RRD tool does not have the permission to update time in the database where it is storing the logs.
An easy fix that works for me is to remove all the RRD db files so that it can be regenerated
Stop the zmlogger or to be safe stop zimbra and then
mkdir /opt/zimbra/logger/db/data/rrds/old
mv /opt/zimbra/logger/db/data/rrds/*.rrd /opt/zimbra/logger/db/data/rrds/old/
start the services back again.