Log Collection on AWS with Logstash
In any environment that it is containerized, virtual or physical and whether it is running on On-Premise or on Cloud, logging is of paramount importance. Normally logs contain important metadata that can be used to identify issues and security risks inside our applications. Logs are the first place we look for, to troubleshoot any issues with our applications and services. If a business critical application goes down or is facing any problems, identifying the problem sooner can save the business from losing money. So it because very important that we should not only collect logs but also index them in a way that it should be very easy to search, analyze and even visualize. For this purpose there are a lot open source and commercial tools available such as Elastic Stack, Splunk, Datadog, etc. All you need is a good log processing tool that can ingest data from different sources and push them into your favourite SIEM solution, one such tool is the Elastic’s Logstash.
Logstash in my opinion is the swiss army knife of log processing tools. Logstash is relatively heavy as compare to its other competitors such Fluentd, but it has many more certified filters and input/output plugins for data sources. Any AWS managed service we use to support our applications will generate logs which are normally stored in AWS S3 or Amazon CloudWatch logs. For example S3 access logs, AWS ELB logs, Amazon CloudFront logs are stored in AWS S3 while AWS VPC flowlogs and AWS WAF logs can be stored in both AWS S3 and Amazon CloudWatch logs.
In this blog post I will show you how you can use a tool like Logstash and process your logs before indexing them. For this blog I will be using Amazon Elasticsearch as my output data source but you can use Datadog, Graphite, CloudWatch or any other supported data sources. You can install and configure Logstash as a package on almost any Linux distro, but I will be running Logstash as a container inside my Amazon ECS cluster. As part of the blog I will use logs generated by different AWS services and index them into Amazon Elasticsearch.
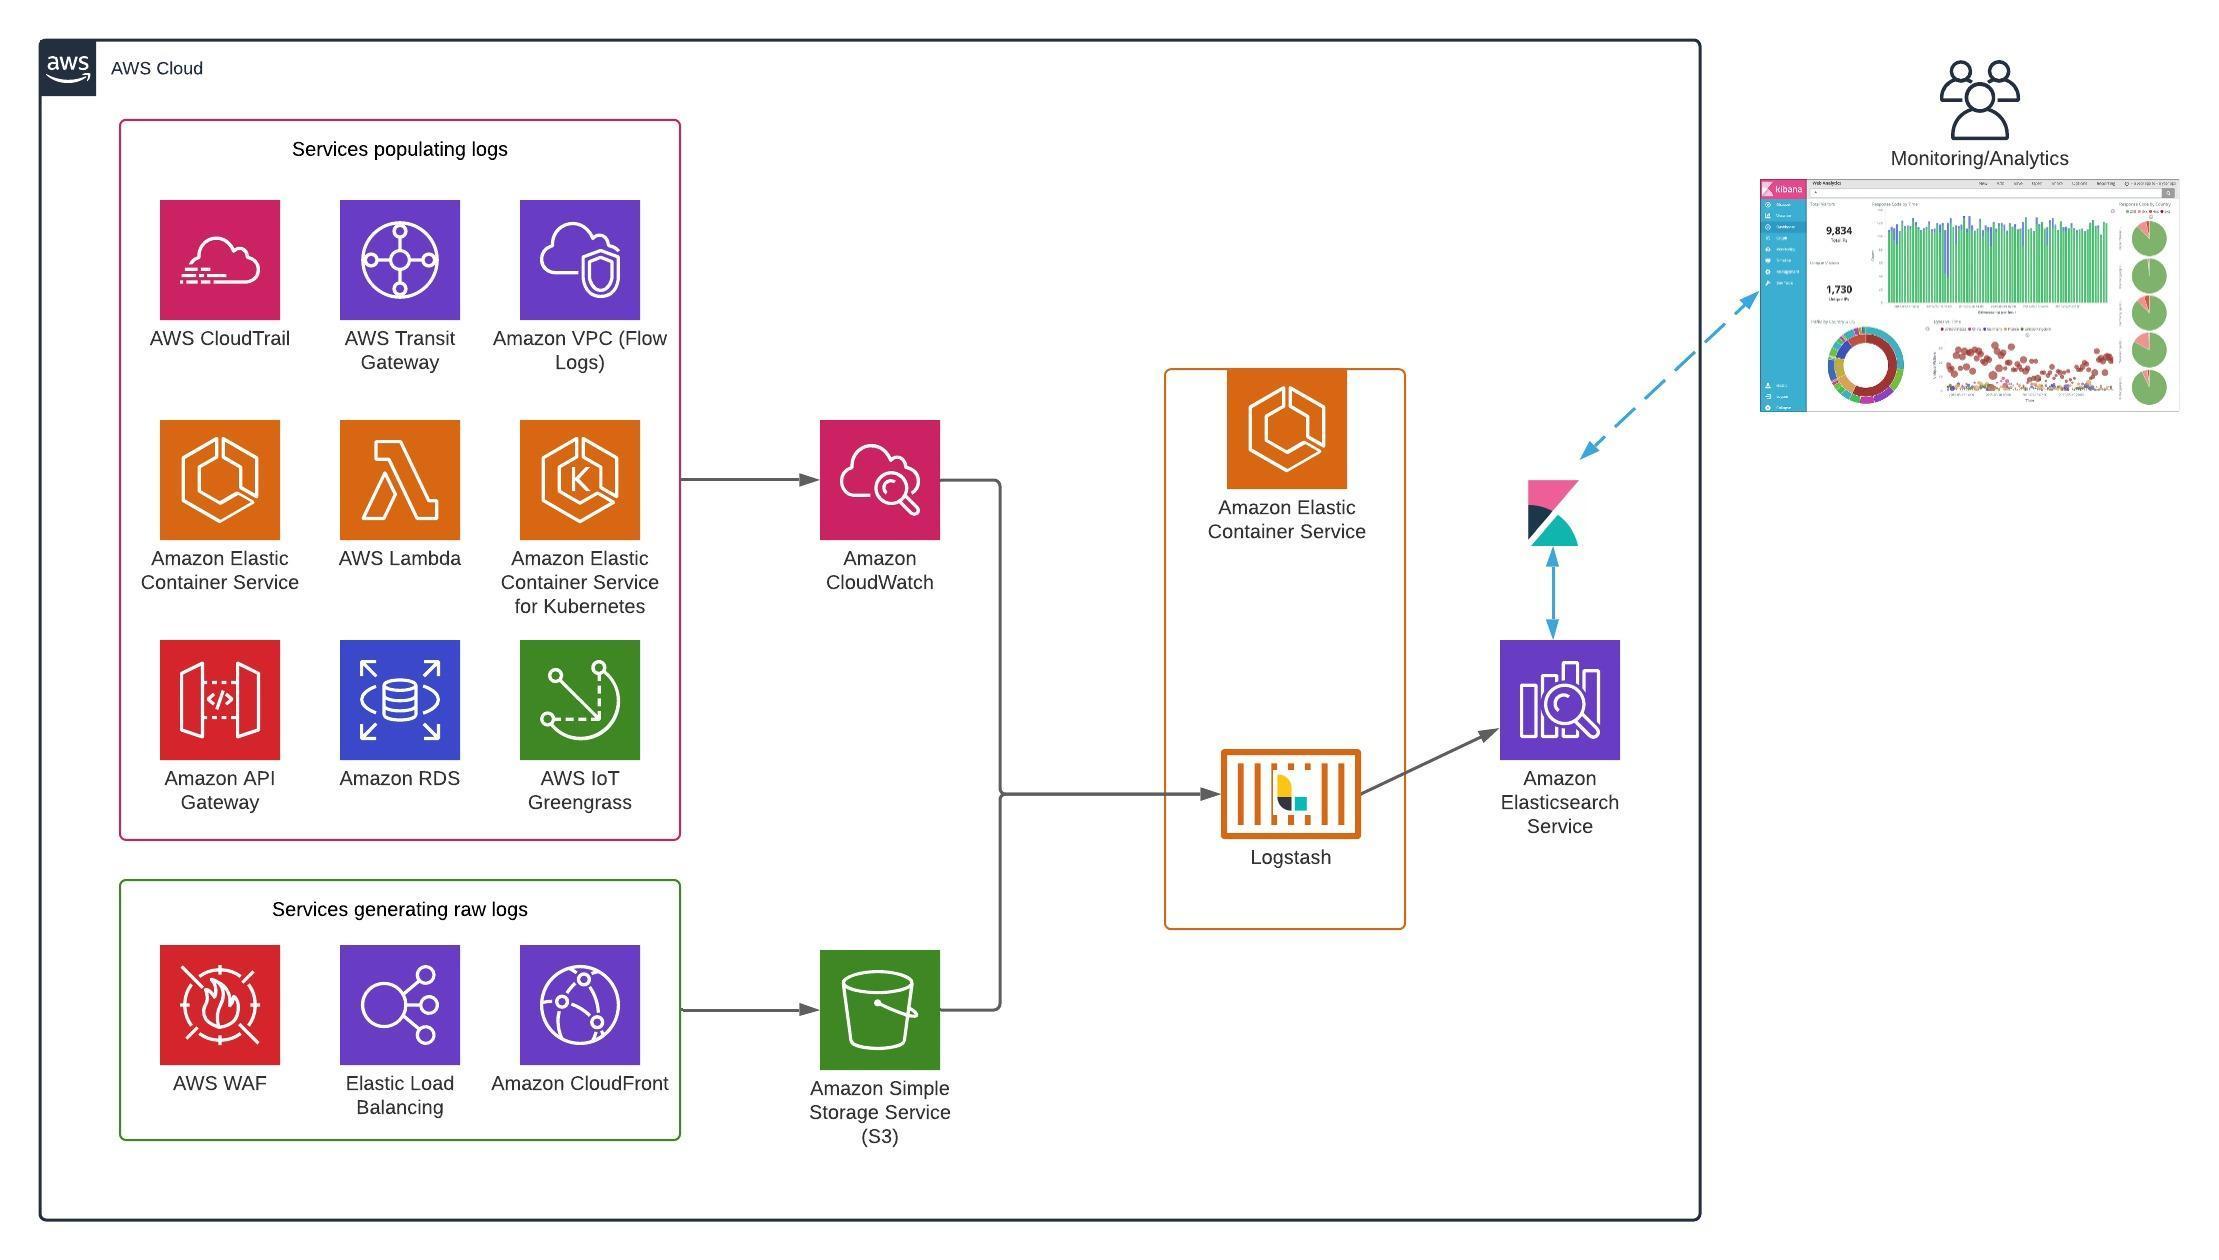
Log Indexing Architecture
The idea is to use Logstash to pull logs generated from different AWS sources and push it into the Amazon Elasticsearch Service. Amazon Elasticsearch Service is a fully managed service that makes it easy for you to deploy, secure, and run Elasticsearch. The service provides support for open source Elasticsearch APIs, managed Kibana, integration with Logstash and other AWS services.
You should have a running Amazon Elasticsearch cluster in order to follow along. But if you have different output data source for example Datadog then you need make modification as per the use case.
Building the Logstash Configuration
The Logstash configuration files defines what our input data sources are and how the data should be indexed and mutated before sending it to the output data source. Logstash configuration has three stages ‘Input’, ‘Filter’, ‘Output’. ‘Input’ stage defines where the logs or data is residing while the ‘Output’ stage tells logstash where to push the filtered logs. Finally in the ‘Filter’ section you create the mapping for your data type, this is where you define which field inside your data is IP, time, integer or string etc. Creating a proper filter is very important because if not done right you will not be able to take advantage of being able to search your logs more granularly and it will be no different than parsing logs directly from the log files.
Logstash provide quite a lot of different filter plugins that can be used to filter our logs. Here you can explore all the available filter plugins. As part of the blog I will create example Logstash configuration for AWS WAF logs and AWS ELB logs.
Example Logstash Config for WAF Logs
The input stage of the below configuration file contains the S3 bucket information such as the bucket name, bucket region and prefix. We can also define the time interval in seconds to wait between to check the file list again after a run is finished. Similarly in the output stage we are defining the Amazon Elasticsearch endpoint and how to create the new index for our data. The logs generated by AWS WAF have a JSON format so I am using the json filter plugin. The ‘date’ and ‘geoip’ plugins will create a mapping in the destination data source. The AWS WAF logs also contains the http headers of the client request which are in Name/Value format, so I am using the ‘ruby’ filter plugin to convert it, such that it because easy to search any http header.
input {
  s3 {
    "region" => "us-east-1"
    "bucket" => "my-waf-logs"
    "prefix" => "WAF"
    "type" => "waf-log"
    "interval" => "300"
    "sincedb_path" => "/tmp/.waf-log_since.db"
  }
}
filter {
  if [type] == "waf-log" {
   json {
        source => "message"
  }
  date {
        match => [ "[timestamp]", "UNIX_MS" ]
  }
  geoip {
        source => [ "[httpRequest][clientIp]" ]
        target => geoip
  }
  ruby {
    code => '
      event.get("[httpRequest][headers]").each { |kv|
        event.set(name = kv["name"], value = kv["value"])}
        '
  }
}
}
output {
  elasticsearch {
    hosts => ["https://elasticsearch-domain-clusterid.us-east-1.es.amazonaws.com:443/"]
    index => "waf-logs-%{+YYYY.MM.dd}"
    ilm_enabled => false
  }
}
Example Logstash Config for ALB Logs
AWS ELB Application Load balancer logs don’t have a particular structure (for example csv, json etc) so I am using the grok filter plugin which is a great way to parse unstructured log data into something structured and queryable. But grok may be a bit difficult to write, here is an online tool to build and debug grok patterns.
grokdebug.herokuapp.com
input {
  s3 {
    "region" => "us-east-1"
    "bucket" => "my-alb-logs"
    "prefix" => "ALB"
    "type" => "alb-log"
    "interval" => "300"
    "sincedb_path" => "/tmp/.alb-log_since.db"
  }
}
filter {
  if [type] == "alb-log" {
    grok {
      match => [ "message", "%{TIMESTAMP_ISO8601:timestamp} %{NOTSPACE:elb} %{IP:clientip}:%{INT:clientport:int} (?:(%{IP:backendip}:?:%{INT:backendport:int})|-)
	%{NUMBER:request_processing_time:float} %{NUMBER:backend_processing_time:float} %{NUMBER:response_processing_time:float} (?:-|%{INT:elb_status_code:int})
	(?:-|%{INT:backend_status_code:int}) %{INT:received_bytes:int} %{INT:sent_bytes:int} \"%{ELB_REQUEST_LINE}\" \"(?:-|%{DATA:user_agent})\"
	(?:-|%{NOTSPACE:ssl_cipher}) (?:-|%{NOTSPACE:ssl_protocol})" ]
    }
    date {
      match => [ "timestamp", "ISO8601"  ]
    }
    geoip {
        source => [ clientip ]
    }
  }
}
output {
  elasticsearch {
    hosts => ["https://elasticsearch-domain-clusterid.us-east-1.es.amazonaws.com:443/"]
    index => "alb-logs-%{+YYYY.MM.dd}"
    ilm_enabled => false
  }
}
Creating Logstash Pipelines
Logstash has the ability to run multiple pipelines from a single Logstash instance. What this means is that we can run two or more configuration file parallelly from same Logstash container/process. Say if I want to run two pipelines from my Logstash container one for WAF logs and the other for ELB logs, my pipeline.yml file will look something like this.
- pipeline.id: waf
  path.config: "/usr/share/logstash/pipeline/waf-log.config"
- pipeline.id: alb
  path.config: "/usr/share/logstash/pipeline/alb-log.config"
Managing the Sincedb in S3 plugin
Each plugin in Logstash has its own configuration options, for example the S3 input plugin I am using in the above examples requires “bucket” settings and some optional settings like “region”, “prefix” etc. One of the optional settings used above is the “sincedb_path”, this is a just a file where the Logstash S3 plugin keeps track of the date the last handled file was added to S3. If this file is not defined, every time Logstash restarts the plugin starts pulling the data from the very beginning. If we were running Logstash inside an EC2 as a process we didn’t had to worry about it, but we are running Logstash as an ephemeral container. For this reason I have modified the docker-entrypoint file and added a startup command to automatically generate “Sincedb” file and update it with the current time. In this way every time the Logstash container restarts, it will pull logs starting from the current time, this means that we may miss some log files but it is better than having lots of duplicate entries. Below is the modified docker-entrypoint file.
#!/bin/bash -e
env2yaml /usr/share/logstash/config/logstash.yml
export LS_JAVA_OPTS="-Dls.cgroup.cpuacct.path.override=/ -Dls.cgroup.cpu.path.override=/ $LS_JAVA_OPTS"

date --date="0 minutes ago" +%Y-%m-%d\ %H:%M:%S\ UTC > /tmp/.alb-logs_since.db
date --date="0 minutes ago" +%Y-%m-%d\ %H:%M:%S\ UTC > /tmp/.waf-log_since.db

if [[ -z $1 ]] || [[ ${1:0:1} == '-' ]] ; then
exec logstash "$@"
else
exec "$@"
fi
Building the Docker Images
With all the changes we need to build the new docker images using the public Logstash image. We need to add the configuration files, the modified pipeline and the docker-entrypoint file. Below is the dockerfile I am using
FROM docker.elastic.co/logstash/logstash:7.9.1
RUN rm -f /usr/share/logstash/pipeline/logstash.conf /usr/share/logstash/config/logstash.yml
ADD alb.conf /usr/share/logstash/pipeline/
ADD waf.conf /usr/share/logstash/pipeline/
ADD logstash.yml /usr/share/logstash/config/
USER root
ADD docker-entrypoint /usr/local/bin/docker-entrypoint
RUN chmod +x /usr/local/bin/docker-entrypoint
We can build the docker image using the following command.
$ docker build my-logstash-demo:v1 .
Finally we will upload the image to our private docker image repository. It can be Amazon ECR, docker hub or any other support image repository.
You can use this github repository integratechfze/logstash-ecs to download all the configuration files. Modify the data source and elasticsearch endpoints inside logstash.yml, alb.conf and waf.conf files.
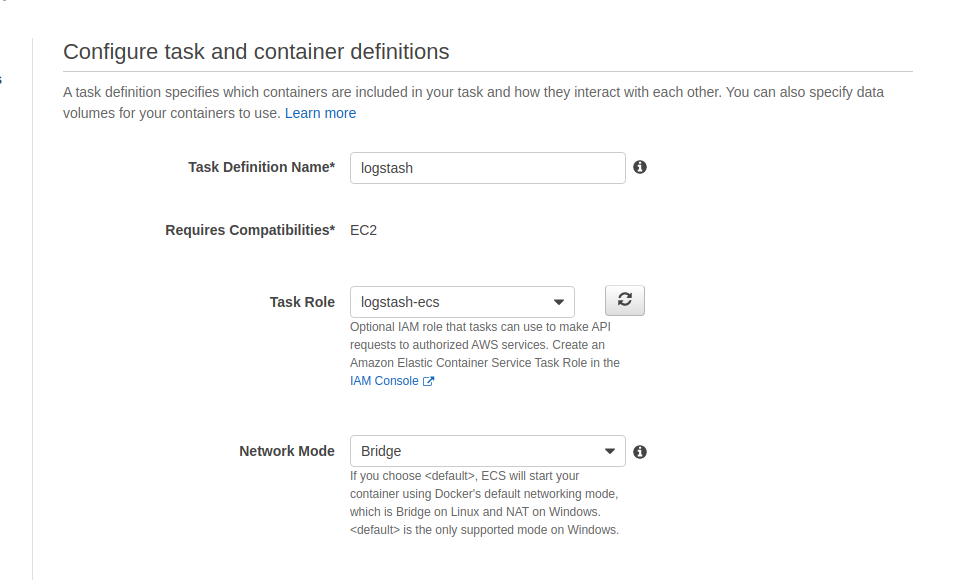
Run the Logstash Service
Before we can run our Logstash service we need to create a task definition and finally create a service that runs the task in our ECS cluster. As part of the task definition we need to assign proper permissions to the Logstash service. We need to create an ECS role and assign read permissions on the S3 buckets where our logs are stored. The network mode could be bridge, since we are not exposing Logstash ports.
Visualizing the Logs in Kibana
Once the Logstash service start it will push logs into our Amazon Elasticsearch cluster, as explained earlier Amazon Elasticsearch comes with build in integrated Kibana service. We can login to Kibana and view our indices under “Index Management”.
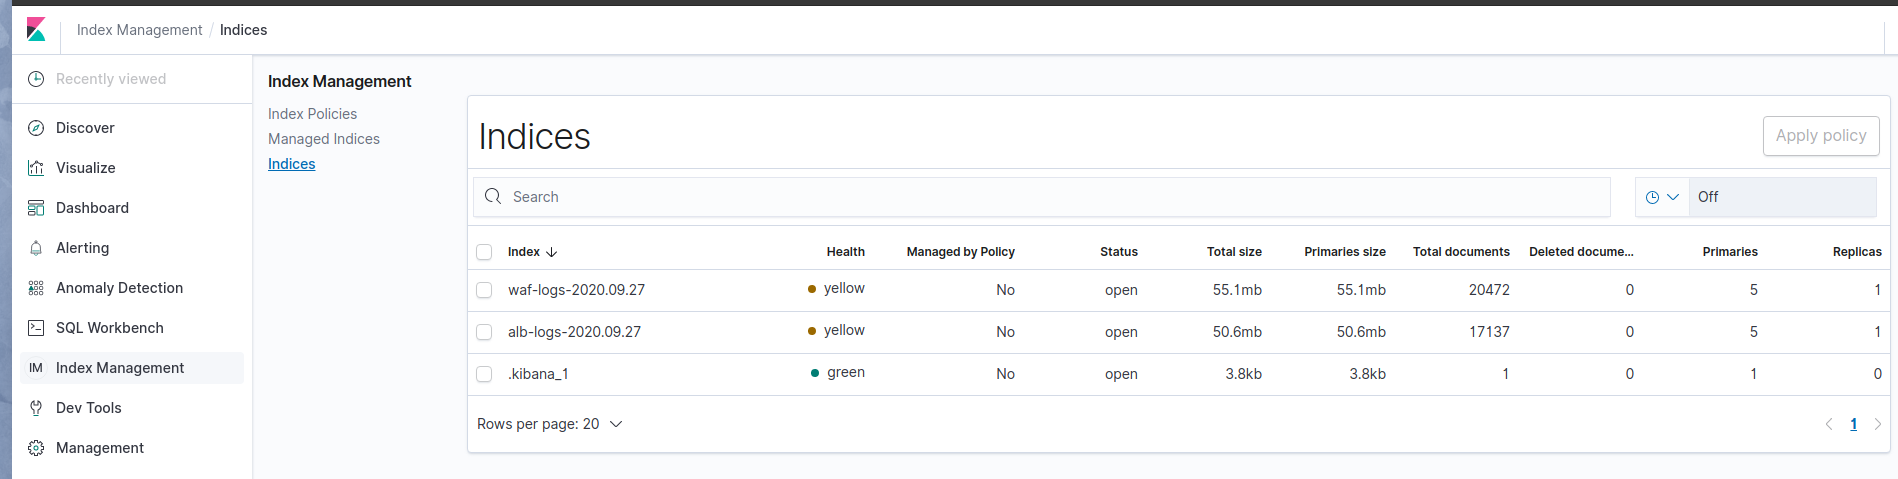
Now we can build “Index Patterns”, Visualization, Dashboards, Alarms and Anomaly Detection on our logs using the Kibana web interface.
Conclusion
Logstash is a very useful tool to move data between different sources, it also have the capability to process those logs before sending it to the final destination. With over 200 plugins we have the capability to transform the data quite easily as compare to writing direct code. Using Logstash we can remain agnostic of how our data sources works, all we need is the right plugin and Logstash will do the rest.